|
|||||


Updated July 5, 2008
|
|||||||||||||||
 Technology Idea: Matching Graphs
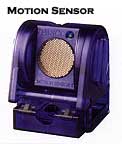

|
|
|
|
|
|
Step 2:
Upon opening the DataStudio file, you will be presented with a distance-time graph that looks something like this:
The red line on the graph represents data that has already been entered. Carefully note the position where data begins on the graph. For example, in the graph above, the data begins at 0.40 m. This indicates how far away you should be from the motion sensor when it starts recording your motion.
Step 3:
Mount the motion sensor on a support rod so that it is aimed at your midsection when you are standing in front of the sensor. Clear the area behind you so that you can move at least 2 meters away from the motion sensor:
Position the computer monitor so you can see the screen while you move away from the motion sensor.
Step 4:
When you are ready, stand in front of the motion sensor. Have a classmate start data recording by pressing the "start" button. There is a three-second countdown before data recording begins. The 'cursor' on the vertical axis of the graph will move up and down as you move forward and backward relative to the sensor. Use the feedback from 'cursor' to find your best starting position.
Watch the plot of your motion on the graph and try to move so the plot of your motion matches the position versus time plot already there.
Step 5:
Repeat the data recording process a second and a third time. Try to improve the match between the plot of your motion and the plot already on the graph.
Analyze:
| 1. | Note the shape of the graph of your motion. What is the description of this motion? (Example: "Constant speed for 2 seconds followed by no motion for 3 seconds, etc.") |
| 2. | Use the "Fit" button above the graph to apply a linear fit for the middle section of your best position versus time plot. You may want to resize the graph to fit the data. The slope of this part of the position versus time plot is the velocity during the selected region of motion. What is the slope of the line of best fit for the middle section of your plot? |
| 3. | What would be the meaning of a steeper slope on the graph? |
Conclude and Apply:
| 4. | What is the relationship between the motion of an object – YOU – and a graph of position and time for your motion? |
Extending:
| 5. | Consider repeating this experiment, but instead of trying to match pre-made data, try to match the graph of motion made by a classmate. Take turns trying to match each other's motion. Once you have done so, answer Analyze question #1 as it applies to the graphs of your motion. |
Copyright 2012 - Nelson |