Updated July 5, 2008 

Technology Idea: Toy Car Motion


Background:

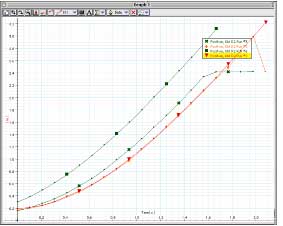
By plotting an object's position on a graph at uniform time intervals, it is possible to draw conclusions regarding the motion of the object by observing the shape of the graph, and comparing it to similar objects.

In this lab, you will use a selection of toy cars and then asked to assess average speed of the vehicles. Any toy from your nearby "dollar store" will do for this activity, or students could be asked to bring in any type of battery powered vehicles from home.

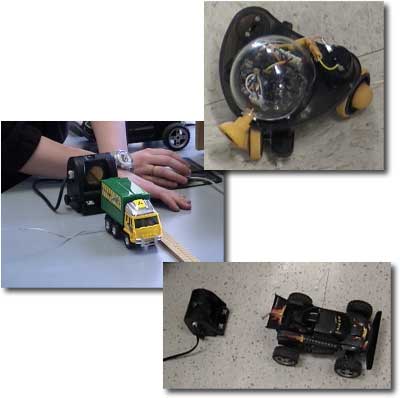
Graph interpretation becomes more interesting and challenging with a wider variety of vehicle types - these toys often have strange behaviours and idiosyncrasies that make the task just a little more challenging.

Technology Idea pdf Download: Toy Car Motion

Purchase the equipment necessary for this probeware lab now from PASCO Canada.


The Question:

What does the motion of a toy car look like on a position-time graph? How does the motion of different toy vehicles compare?

Variables:

This experiment involves these variables: position, time and type of toy vehicle. Identify and state the manipulated, responding, and controlled variables in this investigation.

Materials:

  • motion sensor
  • USB link
  • variety of toy vehicles
  • computer and DataStudio software

Procedure:

Step 1:

Connect your motion sensor to the computer via the USB link, or whatever computer interface you are using:

Step 2:

Configure your data collection software to display a position-time graph.

Step 3:

Place your toy vehicle in front of the sensor. Begin recording data, and then start the toy vehicle into motion. Depending on the toy vehicle, collect data until the vehicle is out of range of the motion sensor. If you did not collect sufficient data, adjust the aim of the motion sensor and repeat the trial.

Step 4:

Repeat step 3 with different toy vehicles after trading with classmates.

Step 5:

When you have completed collecting data from several toy vehicles, scale your data to fit the graph and print it out. Here is an example of a toy car motion graph:

Analyzing and Interpreting:

1. Label the lines on the graph according to which vehicle they represented.
2. On each of the lines, use symbols to label areas of no movement, constant speed, and areas of positive acceleration and negative acceleration.
3. Explain why you labeled the areas as you did in step 2. What is it about the shape of the line on the graph that indicates the various types of motion.
4. How did the motion of the toy vehicles compare? Which toy had the highest constant speed? Which one had the greatest acceleration?

Forming Conclusions:

5. How does the motion of different toy vehicles compare?

Copyright 2012 - Nelson


[ Home ] Contact ] Teacher's Corner ] Order ] [Privacy] [Terms of Use]